Does the Neighborhood You Live in Affect your Diet-Mental Health Relationship?

- Individuals in disadvantaged neighborhoods tend to have higher body mass index and perceived stress
- fMRI scans of these individuals’ brains indicate disruptions in information processing flexibility in brain regions involved in processing rewards, regulating emotions, and higher cognitive functions
- The link between neighborhood characteristics and these neural changes may be partially mediated by obesity, i.e., the body mass index, but not by stress levels (Kilpatrick et al., 2023)
When traveling through towns and cities, it’s noticeable that different areas vary significantly in their appearance and available amenities. Some neighborhoods boast well-maintained, larger, and aesthetically pleasing buildings, while others are defined by smaller, older structures showing signs of disrepair and neglect.
Affluent and disadvantaged neighborhoods
The first type of neighborhood tends to be cleaner, safer, and have better maintained public spaces. It will also have access to upscale amenities such as boutique shops, gourmet restaurants, and cultural attractions. The second type of neighborhood likely has higher crime rates and may have issues with litter and graffiti. There will be fewer local businesses and may lack various amenities. We typically call the first group affluent neighborhoods, while researchers refer to the second group as disadvantaged.
Individuals in disadvantaged neighborhoods typically have lower income levels, limited access to quality education, healthcare, employment opportunities, and substandard living conditions. These individuals often encounter systemic barriers to social mobility, resulting in a lack of access to essential services and readily available resources in more affluent areas (Woolley et al., 2008).
Living in disadvantaged neighborhoods is linked to higher health risks
Living in a disadvantaged neighborhood is linked to various adverse outcomes in the diet-mental health relationship (DMHR). Individuals living in these areas are at a higher risk of obesity due to the poor quality of foods available to them and environments that hamper physical activity (Saelens et al., 2012; Zick et al., 2009). Lower income levels among residents make them more likely to consume ultra-processed foods, a known contributor to obesity (Monteiro et al., 2019). Additionally, chronic stressors linked with living in disadvantaged neighborhoods might increase the desire for highly palatable foods, which are often unhealthy, as a coping response.
Living in a disadvantaged neighborhood is linked to various adverse outcomes in the diet-mental health relationship (DMHR)
Consequently, these factors are associated with adverse neural changes such as reduced brain volume and unfavorable changes in the structure and functioning of specific brain regions. These changes can disrupt the brain’s mechanisms for regulating food intake, leading to obesity and contributing to mental health disorders, such as depression. (Samuthpongtorn et al., 2023; Seabrook et al., 2023). The risks of health problems related to obesity, such as cardiovascular diseases, diabetes, and certain forms of cancer, are increased with the consumption of ultra-processed foods.
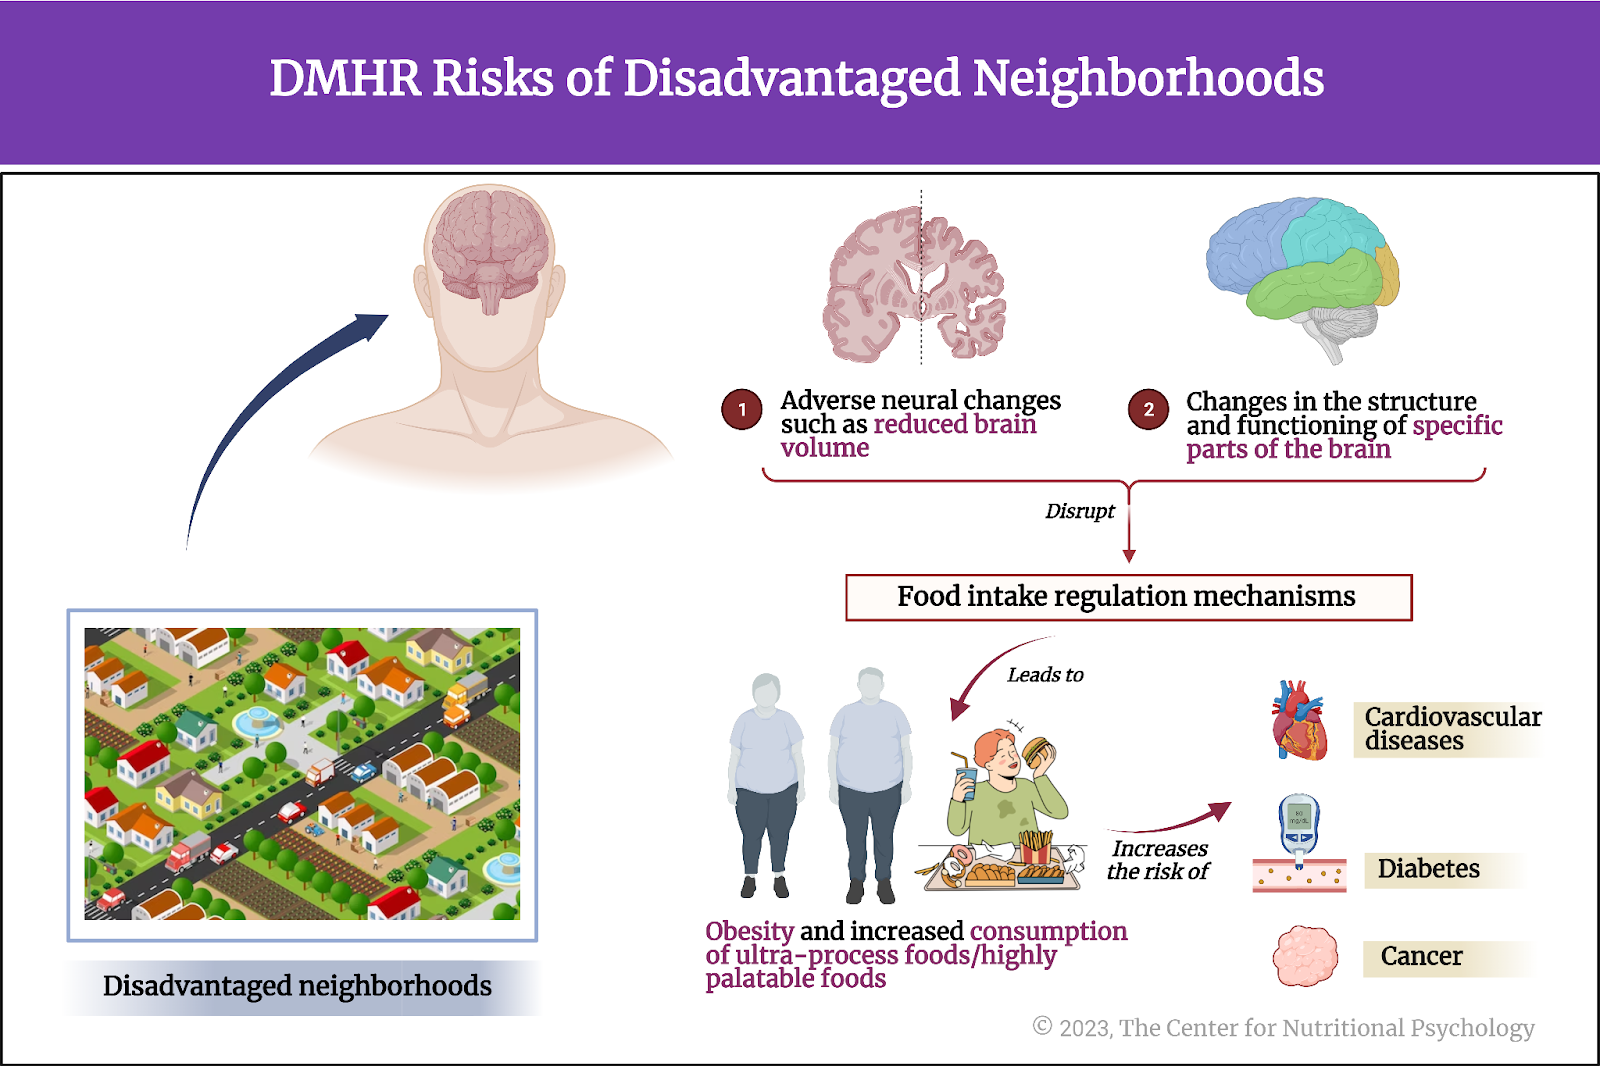
Figure 1. DMHR Risks of disadvantaged neighborhoods: Higher risk of obesity, increased desire, and consumption of ultra-processed foods/highly palatable foods. Changes in brain volume/structure/function, food intake regulation mechanisms, additional health problems: cardiovascular diseases, diabetes, cancer.
Area deprivation index
Whether a neighborhood is considered affluent or disadvantaged is a matter of degree. Some neighborhoods are more disadvantaged, and some are more affluent than others. It can be thought of as a continuum. Researchers use the area deprivation indices to assess a specific geographical area’s socioeconomic disadvantage or affluence (such as a neighborhood).
Whether a neighborhood is considered affluent or disadvantaged is a matter of degree
These indices can be constructed differently, but they typically consider factors such as income, education, employment, housing conditions, and essential services available in the area. Areas with wealthier, more educated residents, better employment, improved housing conditions, and good access to essential services would be considered more affluent. Those with opposite characteristics would be considered more disadvantaged (see Figure 2).

Figure 2. Area Deprivation Index features
The current study
Study author Lisa A. Kilpatrick, and her colleagues aimed to investigate the relationship between the area deprivation index (ADI) and the microstructure of the brain cortex, assessed by the T1w/T2w ratio. They also explored how body mass index and stress affect that link.
They hypothesized that individuals living in areas with worse area deprivation index values would likely have higher body mass indexes, be more prone to diets conducive to obesity, and experience higher stress levels. Consequently, these factors would negatively impact the microstructure of their brain, particularly in the areas related to processing rewards, regulating emotions, and cognition.
T1- and T2-weighted images and T1w/T2w ratio
T1-weighted (T1w) and T2-weighted (T2w) images are two types of magnetic resonance imaging (MRI) sequences used to visualize and differentiate various tissues within the human body. In neuroimaging, T1-weighted images provide excellent structural details and are used to highlight distinctions between various brain tissues, making them useful for visualizing specific areas of the brain. T2-weighted images emphasize differences in water content within the brain, making them valuable for detecting abnormalities like edema, inflammation, and lesions—areas where the brain tissue is damaged. They are also useful for assessing regions filled with cerebrospinal fluid. (see Figure 3).
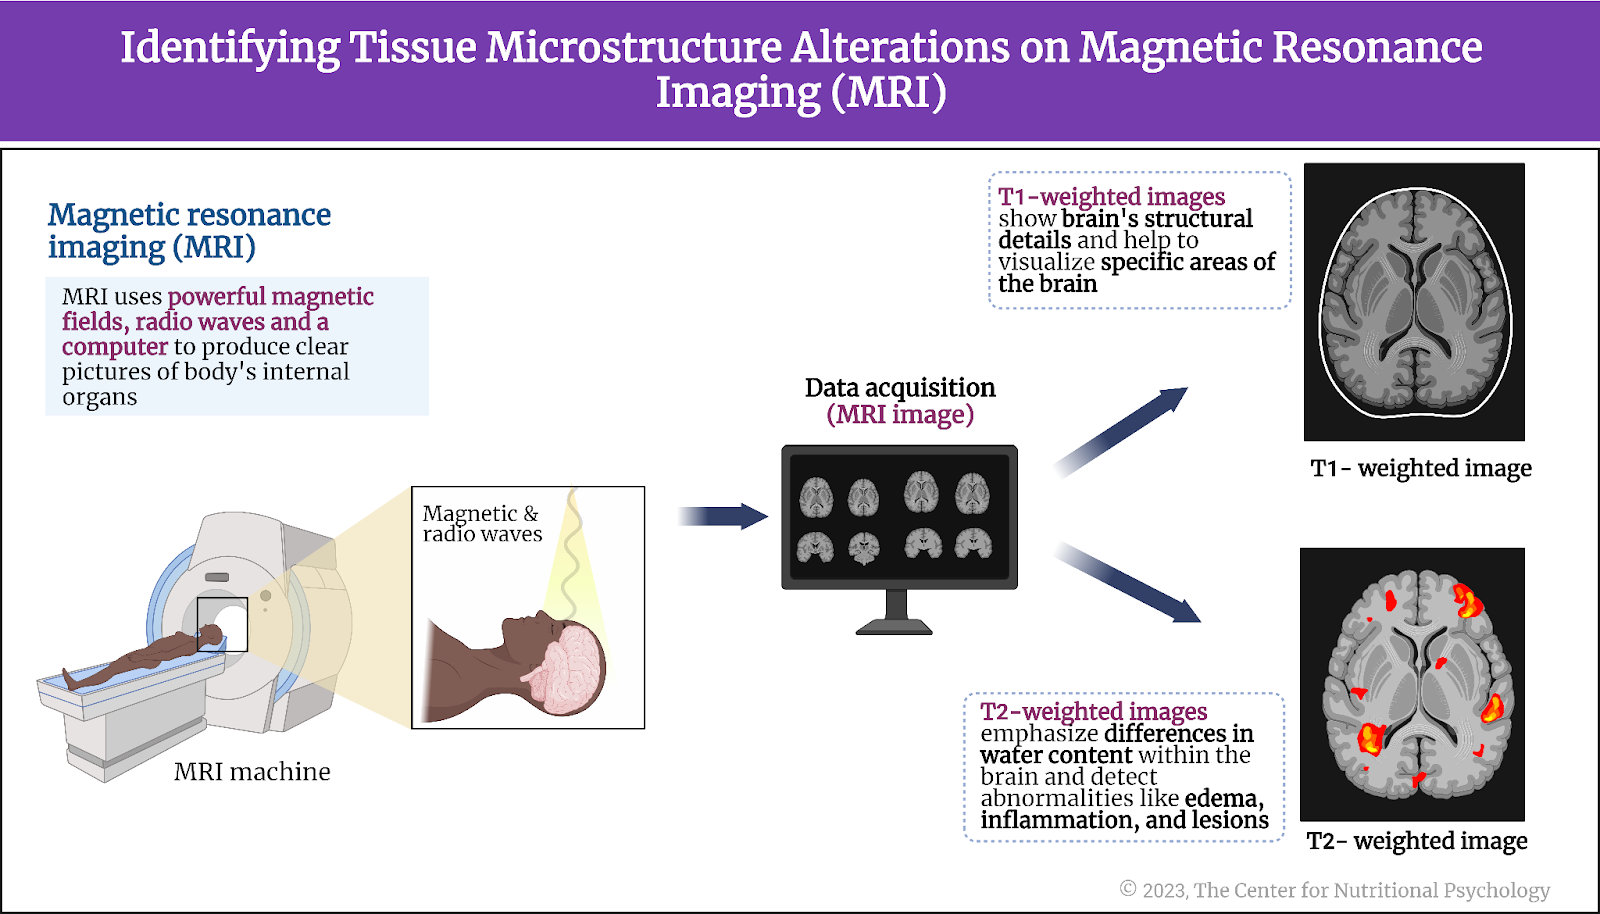
Figure 3. Identifying tissue microstructure alterations on magnetic resonance imaging (MRI)
Researchers often compare signal intensities in these two types of images of the same brain area and calculate a measure called the T1w/T2w ratio. The T1w/T2w ratio can offer a more nuanced and quantitative understanding of the brain’s tissue properties, surpassing the insights provided by qualitative visual analysis alone. It can help researchers identify microstructural differences in the brain, areas where a certain disease is developing or present, regions with altered functionality, injuries, and other changes to the brain tissue.
In general, both a decrease and an increase in the T1w/T2w ratio in a brain region can indicate adverse developments in it, as it indicates that the tissue structure in that area differs from that observed in the brains of healthy individuals.
The procedure
The study involved 92 adults from the Los Angeles area, consisting of 27 men and 65 women. Between 2019 and 2022, participants underwent neuroimaging sessions encompassing T1w and T2w scanning. Details about their place of residence were also gathered. Participants were recruited using flyers and emails distributed through various channels. The mean age of participants was 28 years.
Participants underwent a stress assessment using the Perceived Stress scale and provided dietary information through the VioScreen Graphical Food Frequency System. Researchers measured their weight and height to calculate body mass index values.
Findings
Area deprivation index was linked with microstructural alterations in brain regions responsible for reward processing, emotion regulation, and higher cognition.
Participants living in more deprived areas, i.e., areas with worse area deprivation index values, had increased T1w/T2w ratios in brain regions involved in reward-related processing, emotional regulation, and higher cognition. These were observed in the medial prefrontal and cingulate regions – mainly at middle/superficial cortical levels.
They also had decreased T1w/T2w ratios in regions of the neural system involved in social interaction. The affected areas were supramarginal, middle temporal, and primary motor regions in mainly middle/deep cortical levels. Both increased and decreased T1w/T2w ratios can be interpreted as indicators of adverse changes to the microstructure of neural tissue in the affected areas. Consequently, this suggests that the functioning of these areas is not as optimal as in a healthy brain. (see Figure 4).
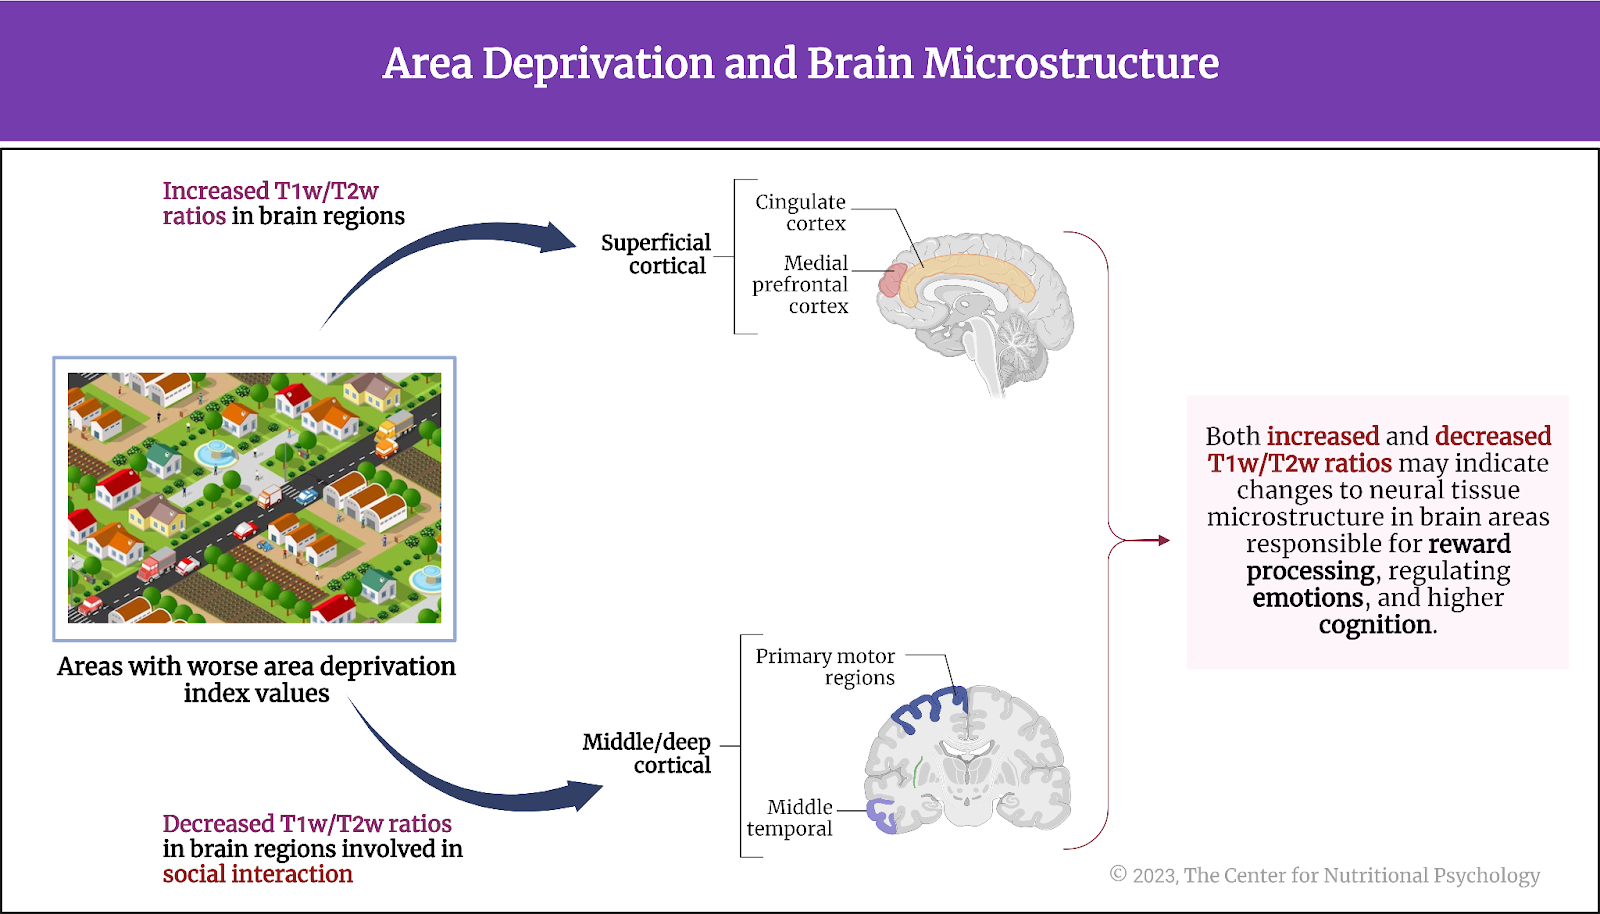
Figure 4. Area deprivation and brain microstructure
Body mass index mediates the link between area deprivation and altered brain microstructure
The study authors created and tested a statistical model suggesting that living in a more disadvantaged area correlates with higher body mass index values and increased stress. According to this model, these factors contribute to pronounced changes in the T1w/T2w ratios in the brain regions where alterations were observed. In other words, they proposed that body mass index (i.e., being obese or overweight) and stress mediate the relationship between area disadvantage and the extent of changes to the microstructure of specific brain areas.
They proposed that body mass index (i.e., being obese or overweight) and stress mediate the relationship between area disadvantage and the extent of changes to the microstructure of specific brain areas
Analysis showed that although individuals living in more disadvantaged neighborhoods tend to experience higher stress levels, this does not lead to changes in the brain microstructure. On the other hand, this analysis confirmed that the link between area deprivation and the microstructure of specific brain areas is mediated by body mass index. However, the body mass index did not fully account for this link, indicating that additional factors likely contribute to the association between altered brain microstructure and area deprivation level.
Conclusion
Overall, the study showed that individuals living in more disadvantaged areas tend to have altered tissue structures in brain regions responsible for reward processing, emotion regulation, and cognition. These alterations to the tissue microstructure may disrupt the flexibility of information processing in these areas. Additionally, a significant portion of these brain changes is associated with obesity and likely connected to factors that contribute to obesity.
The study showed that individuals living in more disadvantaged areas tend to have altered tissue structures in brain regions responsible for reward processing, emotion regulation, and cognition
Due to the study’s design, it remains unclear whether life in disadvantaged neighborhoods leads to obesity and adverse changes in brain microstructure or if the altered brain microstructure restricts an individual’s ability to secure resources necessary for living in more affluent neighborhoods and avoid dietary behaviors that lead to obesity. While this will have to be explored in future research, it is important for both policymakers and the general public to be aware of the connections between life in disadvantaged neighborhoods and brain health.
The paper “Mediation of the association between disadvantaged neighborhoods and cortical microstructure by body mass index” was authored by Lisa A. Kilpatrick, Keying Zhang, Tien S. Dong, Gilbert C. Gee, Hiram Beltran-Sanchez, May Wang, Jennifer S. Labus, Bruce D. Naliboff, Emeran A. Mayer, and Arpana Gupta.
References
Kilpatrick, L. A., Zhang, K., Dong, T. S., Gee, G. C., Beltran-Sanchez, H., Wang, M., Labus, J. S., Naliboff, B. D., Mayer, E. A., & Gupta, A. (2023). Mediation of the association between disadvantaged neighborhoods and cortical microstructure by body mass index. Communications Medicine, 3(1). https://doi.org/10.1038/s43856-023-00350-5
Monteiro, C. A., Cannon, G., Levy, R. B., Moubarac, J. C., Louzada, M. L. C., Rauber, F., Khandpur, N., Cediel, G., Neri, D., Martinez-Steele, E., Baraldi, L. G., & Jaime, P. C. (2019). Ultra-processed foods: What they are and how to identify them. In Public Health Nutrition (Vol. 22, Issue 5, pp. 936–941). Cambridge University Press. https://doi.org/10.1017/S1368980018003762
Saelens, B. E., Sallis, J. F., Frank, L. D., Couch, S. C., Zhou, C., Colburn, T., Cain, K. L., Chapman, J., & Glanz, K. (2012). Obesogenic Neighborhood Environments, Child and Parent Obesity: The Neighborhood Impact on Kids Study. American Journal of Preventive Medicine, 42(5), e57–e64. https://doi.org/10.1016/J.AMEPRE.2012.02.008
Samuthpongtorn, C., Nguyen, L. H., Okereke, O. I., Wang, D. D., Song, M., Chan, A. T., & Mehta, R. S. (2023). Consumption of Ultraprocessed Food and Risk of Depression. JAMA Network Open, 6(9), e2334770. https://doi.org/10.1001/jamanetworkopen.2023.34770
Seabrook, L. T., Naef, L., Baimel, C., Judge, A. K., Kenney, T., Ellis, M., Tayyab, T., Armstrong, M., Qiao, M., Floresco, S. B., & Borgland, S. L. (2023). Disinhibition of the orbitofrontal cortex biases decision-making in obesity. Nature Neuroscience, 26(1), 92–106. https://doi.org/10.1038/s41593-022-01210-6
Woolley, M. E., Grogan-Kaylor, A., Gilster, M. E., Karb, R. A., Gant, L. M., Reischl, T. M., & Alaimo, K. (2008). Neighborhood Social Capital, Poor Physical Conditions, and School Achievement. Children & Schools, 30(3), 133–145. https://doi.org/10.1093/CS/30.3.133
Zick, C. D., Smith, K. R., Fan, J. X., Brown, B. B., Yamada, I., & Kowaleski-Jones, L. (2009). Running to the Store? The relationship between neighborhood environments and the risk of obesity. Social Science & Medicine, 69(10), 1493–1500. https://doi.org/10.1016/J.SOCSCIMED.2009.08.032